Get a Thread Dump
A thread dump is a list of all the Java threads that are currently active in a Java Virtual Machine (JVM).
There are several ways to take thread dumps from a JVM. It is highly recommended to take more than 1 thread dump. A good practice is to take 10 thread dumps at a regular interval (for example, one thread dump every 20 to 30 seconds).
1. A Thread Dump Using jVisualVM
We can generate thread dump for any process using VisualVM profiler very easily. You just need to right click on the running process and click on “Thread Dump” option to generate it. Jvisualvm is available in jdk/bin folder.

2. Getting a Thread Dump Using jstack
Java comes with jstack tool through which we can generate thread dump for a java process. This is a two-step process.
Step 1: Find out the PID of the java process using ps -ef | grep java command in Linux and jps command in windows. (jps command also working in Linux).
Step 2: Run jstack tool as jstack PID to generate the thread dump output to console, you can append thread dump output to file using command
"jstack PID >> mythreaddump.dump"

3. Getting a Thread Using Kill Command
We can use kill -3 PID command to generate the thread dump. This is slightly different from other ways to generate thread dump. When kill command is issued, thread dump is generated to the System out of the program. So, if it’s a java program with console as system out, the thread dump will get printed on the console. If you want thread dump output file then you need to configure jvm options
-XX:+UnlockDiagnosticVMOptions -XX:+LogVMOutput -XX:LogFile= "/var/log/mythreaddump.dump"

Here
-XX:UnlockDiagnosticVMOptions option that unlocks diagnostic JVM options.
-XX:+LogVMOutput (requires -XX:+UnlockDiagnosticVMOptions) Logs all the vm output.
-XX:LogFile=file (requires -XX:+UnlockDiagnosticVMOptions)  Specifies the path and name.
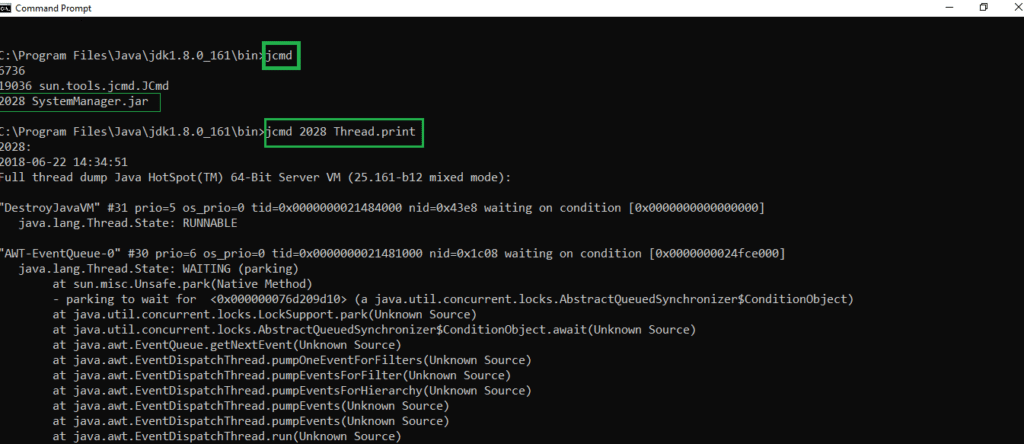
4. Getting a Thread Dump Using jcmd
Java 8 has introduced jcmd utility. You should use this instead of jstack if you are on Java 8 or higher. Command to generate thread dump using jcmd is
jcmd PID Thread.print

Once we got the file then we need to upload thread dump file in following site
this site can analyze thread dump and spot problems.

After upload your dump file and then click Analyze button.

That’s it guys. This is all about Thread Dump Tutorial. Let me know your comments and suggestions about this tutorial. Thank you.